Abstract
Does globalization force the welfare state to shrink?
It is one of the most persistent claims in economic debate: once capital, firms and labour can move across borders, countries must cut taxes to hold on to them — and then they cannot afford welfare. The opposite claim is just as widespread: open economies are more exposed to external shocks, so citizens demand more social insurance, not less. Both stories are plausible, both have prominent advocates, and they cannot both be right. We tested them on 44 years of data from 32 wealthy countries.
Research Questions
Does the association between globalization and social security transfers, as found in Yay and Aksoy (2018), remain valid when the sample is extended to 2023?
Does the association differ systematically across welfare regimes — or is the regime heterogeneity in the literature an artefact of the period chosen?
Is the relationship stable over time at all, and what does the answer imply for the single coefficients the literature normally reports?
Method & Identification
Model Framework
Two-way fixed effects panel model with country effects δᵢ and year effects γₜ. Social security transfers as a percentage of GDP proxy for the size of the welfare state, and every right-hand-side variable enters with a one-year lag.
Identification Strategy
Two specifications. The baseline estimates each KOF index separately with macroeconomic and demographic controls. The heterogeneity specification adds interaction terms between globalization and four welfare regimes, with the social democratic regime as reference, and regime-specific marginal effects are recovered afterwards.
Data & Frequency
32 OECD countries, annual observations 1980–2023, N = 996 in the fully specified models. Dependent variable from CPDS; globalization from KOF; controls from the OECD and the World Bank.
Estimation Approach
Within estimator with standard errors clustered by country. Robustness via Driscoll-Kraay standard errors, rolling regressions over 10-year windows, a Chow test for a structural break, and feedback regressions for reverse causality.
Findings
-
No robust overall relationship. Of the four KOF indices, only social globalization is significant in the baseline (β = 0.129, t = 2.63). Overall globalization (0.088), economic (−0.020) and political (0.046) are all insignificant under country-clustered standard errors.
-
The one significant result is likely reverse causality. Feedback regressions show that lagged social security transfers predict social globalization (β = 0.225, t = 2.15) — the opposite direction to the one the literature normally studies.
-
Regime differences are real but weaker than they look. The Mediterranean regime differs positively from the social democratic one on all four indices, and the liberal regime on overall and economic globalization. But interaction terms measure differences from the reference, not effects in their own right.
-
Turning to marginal effects within each regime, only one estimate is significant: economic globalization in social democratic welfare states, with a coefficient of −0.187 — the only genuine support for the efficiency hypothesis in the whole analysis.
-
The relationship is historically contingent. Rolling regressions over 10-year windows show coefficients that are insignificant or negative before 2015 and turn positive and significant in the windows dominated by post-crisis observations (overall globalization: 0.183 in the window ending 2023).
-
A Chow test rejects parameter stability at 2008 for all four indices (F between 4.9 and 9.9, all p < 0.001). The regime heterogeneity reported by Yay and Aksoy (2018) therefore does not hold once the sample is extended to 2023.
Technical Robustness & Reflection
Critical answers to methodological choices
The Results in Plain English
A popular science breakdown of the main conclusions without technical jargon.
Neither holds in general. There simply is no stable relationship between how globalized a country is and how much it spends on social transfers. But the most useful result is not the null itself — it is that the question is posed wrongly. When we looked at ten-year stretches one at a time instead of the whole period at once, the relationship turned out to change sign along the way. Before the financial crisis it points weakly one way; after it, the other. Which means two researchers can study exactly the same question with exactly the same method and reach opposite conclusions, purely because their data stop in different years. That goes a long way towards explaining why the research in this area has disagreed with itself for so long.
Literature Network
The graph is interactive and pulls in a 3D library of roughly 1.2 MB. It loads only when you ask for it.
Intellectual Lineage
The paper is a direct extension of Yay and Aksoy (2018) and draws on two literatures: the theoretical debate between the compensation and efficiency hypotheses, and the welfare regime literature following Esping-Andersen. The graph shows the citation network with this paper at the centre.
Interaction
Drag to rotate • Scroll to zoom
Bibliography
- Agersnap, O., Jensen, A., & Kleven, H. (2020). The Welfare Magnet Hypothesis: Evidence from an Immigrant Welfare Scheme in Denmark. American Economic Review: Insights, 2(4), 527–542.
- Alesina, A., & Wacziarg, R. (1998). Openness, country size and government. Journal of Public Economics, 69(3), 305–321.
- Armingeon, K., Engler, S., Leemann, L., & Weisstanner, D. (2025). Comparative Political Data Set 1960–2023. University of Zurich, Leuphana University Lueneburg, and University of Lucerne.
- Autor, D. H., Dorn, D., & Hanson, G. H. (2013). The China Syndrome: Local Labor Market Effects of Import Competition in the United States. American Economic Review, 103(6), 2121–2168.
- Bergh, A. (2021). The compensation hypothesis revisited and reversed. Scandinavian Political Studies, 44(2), 140–147.
- Bohle, D., & Greskovits, B. (2007). Neoliberalism, embedded neoliberalism and neocorporatism: Towards transnational capitalism in Central-Eastern Europe. West European Politics, 30(3), 443–466.
- Brady, D., Beckfield, J., & Seeleib-Kaiser, M. (2005). Economic Globalization and the Welfare State in Affluent Democracies, 1975–2001. American Sociological Review, 70(6), 921–948.
- Busemeyer, M. R. (2009). From myth to reality: Globalisation and public spending in OECD countries revisited. European Journal of Political Research, 48(4), 455–482.
- Devereux, M. P., Lockwood, B., & Redoano, M. (2008). Do countries compete over corporate tax rates? Journal of Public Economics, 92(5–6), 1210–1235.
- Dreher, A. (2006a). Does globalization affect growth? Evidence from a new index of globalization. Applied Economics, 38(10), 1091–1110.
- Dreher, A. (2006b). The influence of globalization on taxes and social policy: An empirical analysis for OECD countries. European Journal of Political Economy, 22(1), 179–201.
- Driscoll, J. C., & Kraay, A. C. (1998). Consistent Covariance Matrix Estimation with Spatially Dependent Panel Data. The Review of Economics and Statistics, 80(4), 549–560.
- Egger, P. H., Nigai, S., & Strecker, N. M. (2019). The Taxing Deed of Globalization. American Economic Review, 109(2), 353–390.
- Esping-Andersen, G. (1990). The Three Worlds of Welfare Capitalism. Princeton University Press.
- Ferrera, M. (1996). The 'Southern Model' of Welfare in Social Europe. Journal of European Social Policy, 6(1), 17–37.
- Fetzer, T. (2019). Did Austerity Cause Brexit? American Economic Review, 109(11), 3849–3886.
- Frankel, J. A., & Romer, D. (1999). Does Trade Cause Growth? American Economic Review, 89(3), 379–399.
- Giovanni, J. di, & Levchenko, A. A. (2009). Trade Openness and Volatility. The Review of Economics and Statistics, 91(3), 558–585.
- Gygli, S., Haelg, F., Potrafke, N., & Sturm, J.-E. (2025). The KOF Globalisation Index – Revisited. The Review of International Organizations, 14(3), 543–574.
- Hines Jr., J. R., & Summers, L. H. (2009). How Globalization Affects Tax Design. Tax Policy and the Economy, 23(1), 123–158.
- Kim, T. K., & Zurlo, K. (2009). How does economic globalisation affect the welfare state? Focusing on the mediating effect of welfare regimes. International Journal of Social Welfare, 18(2), 130–141.
- Leibrecht, M., Klien, M., & Onaran, Ö. (2011). Globalization, welfare regimes and social protection expenditures in Western and Eastern European countries. Public Choice, 148(3), 569–594.
- Marshall, J., & Fisher, S. D. (2015). Compensation or Constraint? How Different Dimensions of Economic Globalization Affect Government Spending and Electoral Turnout. British Journal of Political Science, 45(2), 353–389.
- Meinhard, S., & Potrafke, N. (2012). The Globalization–Welfare State Nexus Reconsidered. Review of International Economics, 20(2), 271–287.
- Pesaran, M. H. (2004). General Diagnostic Tests for Cross Section Dependence in Panels. IZA Discussion Paper 1240.
- Potrafke, N. (2015). The Evidence on Globalisation. The World Economy, 38(3), 509–552.
- Rodrik, D. (1998). Why Do More Open Economies Have Bigger Governments? Journal of Political Economy, 106(5), 997–1032.
- Shelton, C. A. (2007). The size and composition of government expenditure. Journal of Public Economics, 91(11–12), 2230–2260.
- Yay, G. G., & Aksoy, T. (2018). Globalization and the welfare state. Quality & Quantity, 52(3), 1015–1040.
Figures from the paper
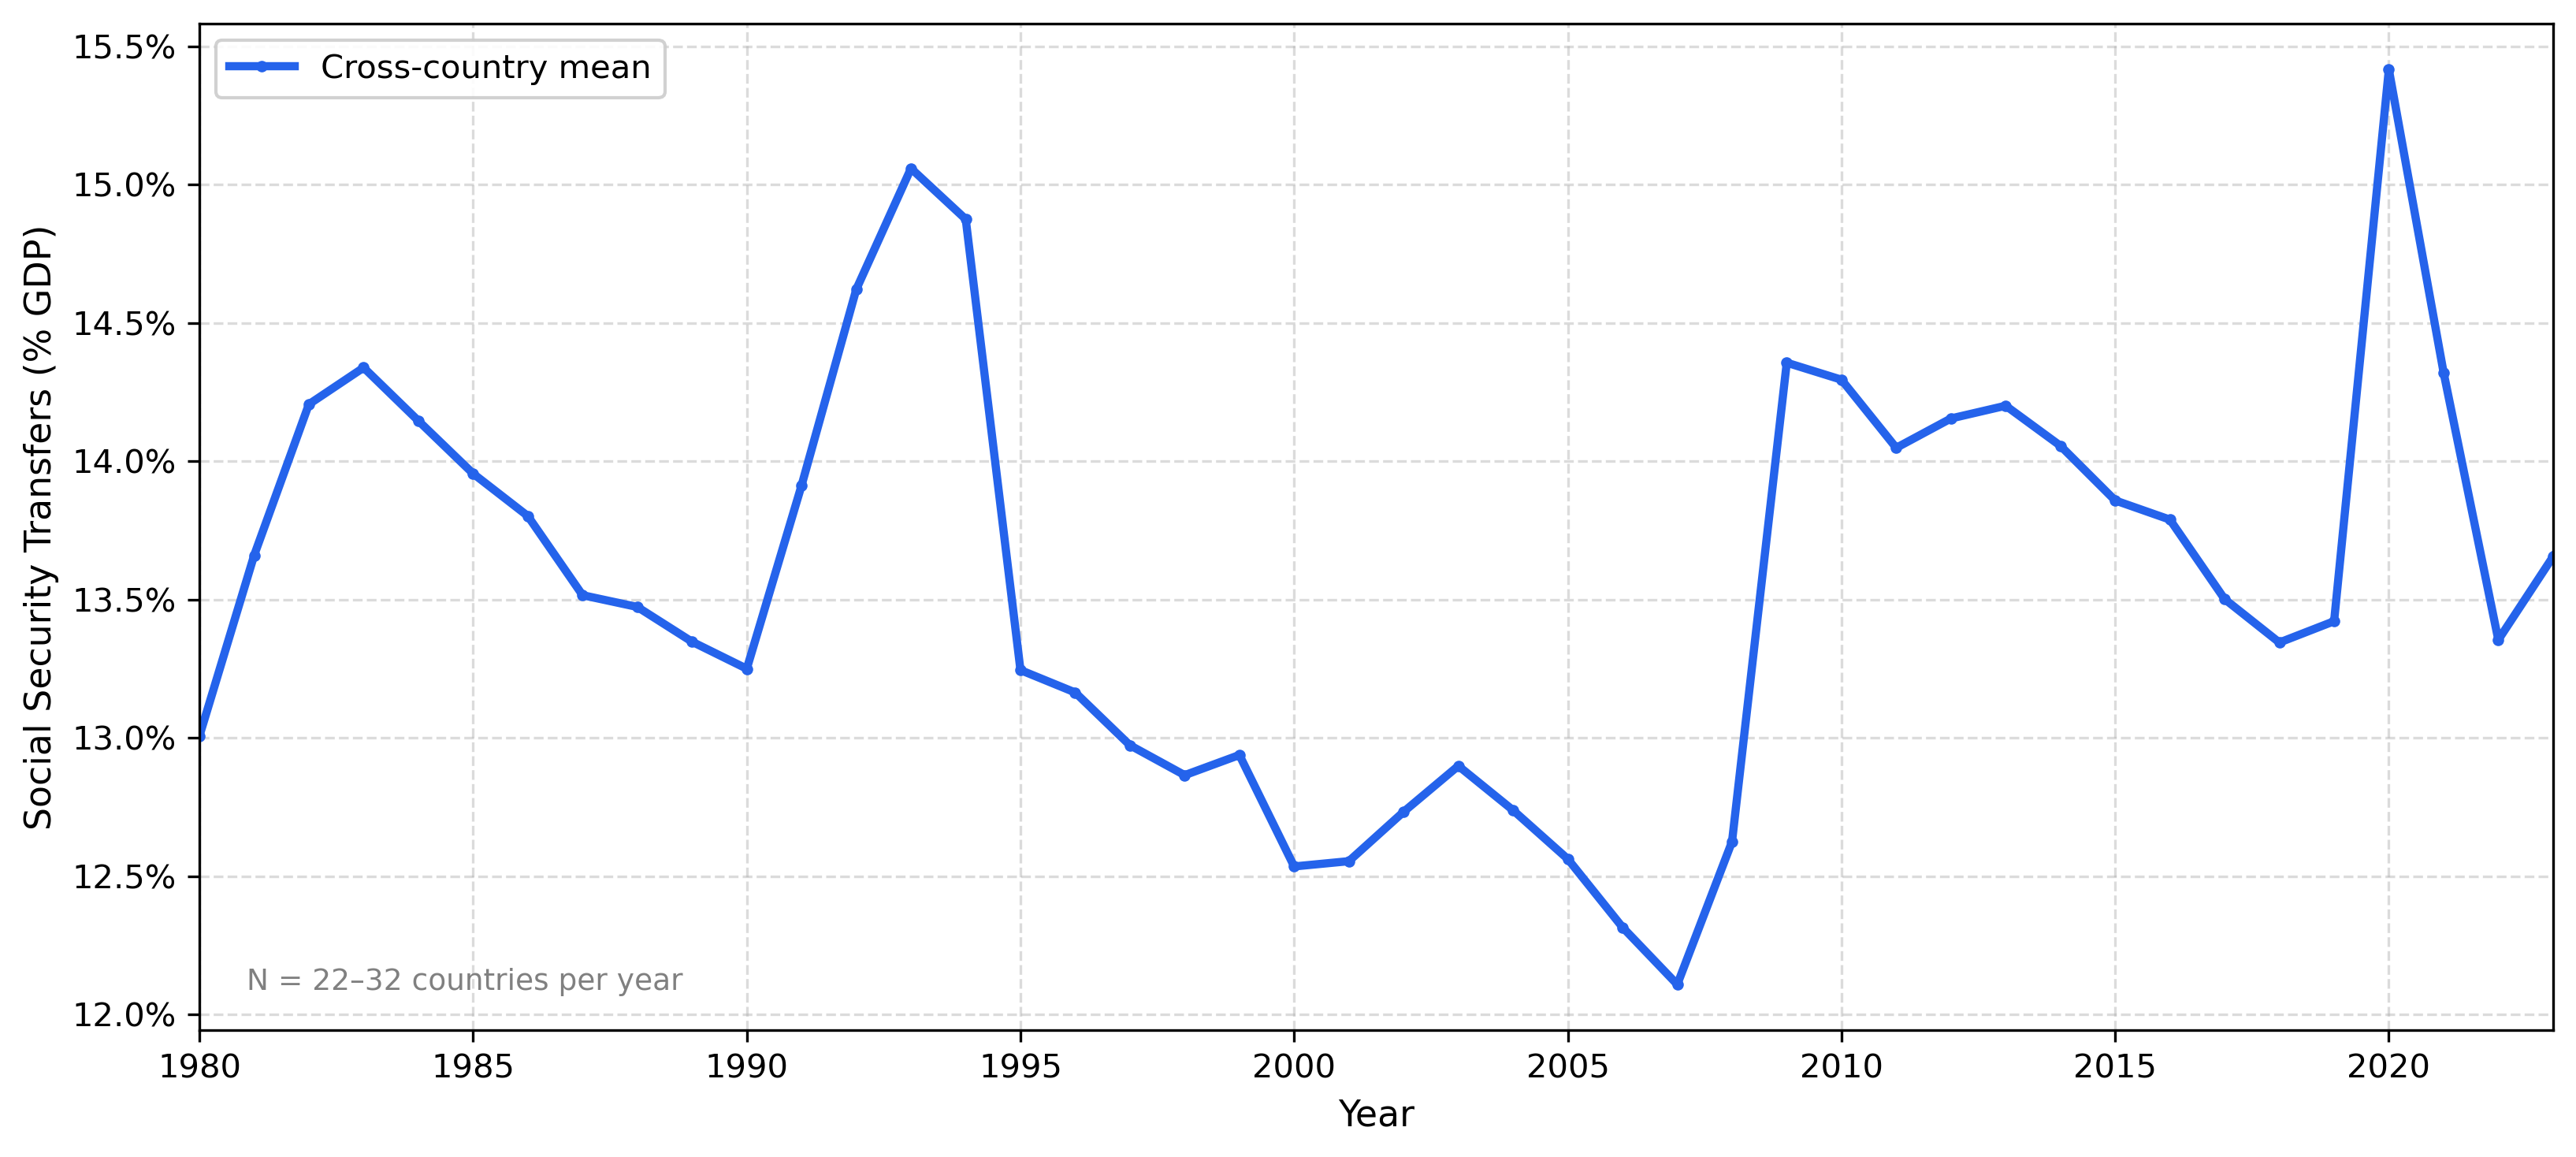
Figure 3.1 — Average social security transfers as a share of GDP, 1980–2023. The two jumps in 2009 and 2020 are the financial crisis and the pandemic; they are what makes a single coefficient across the whole period misleading.
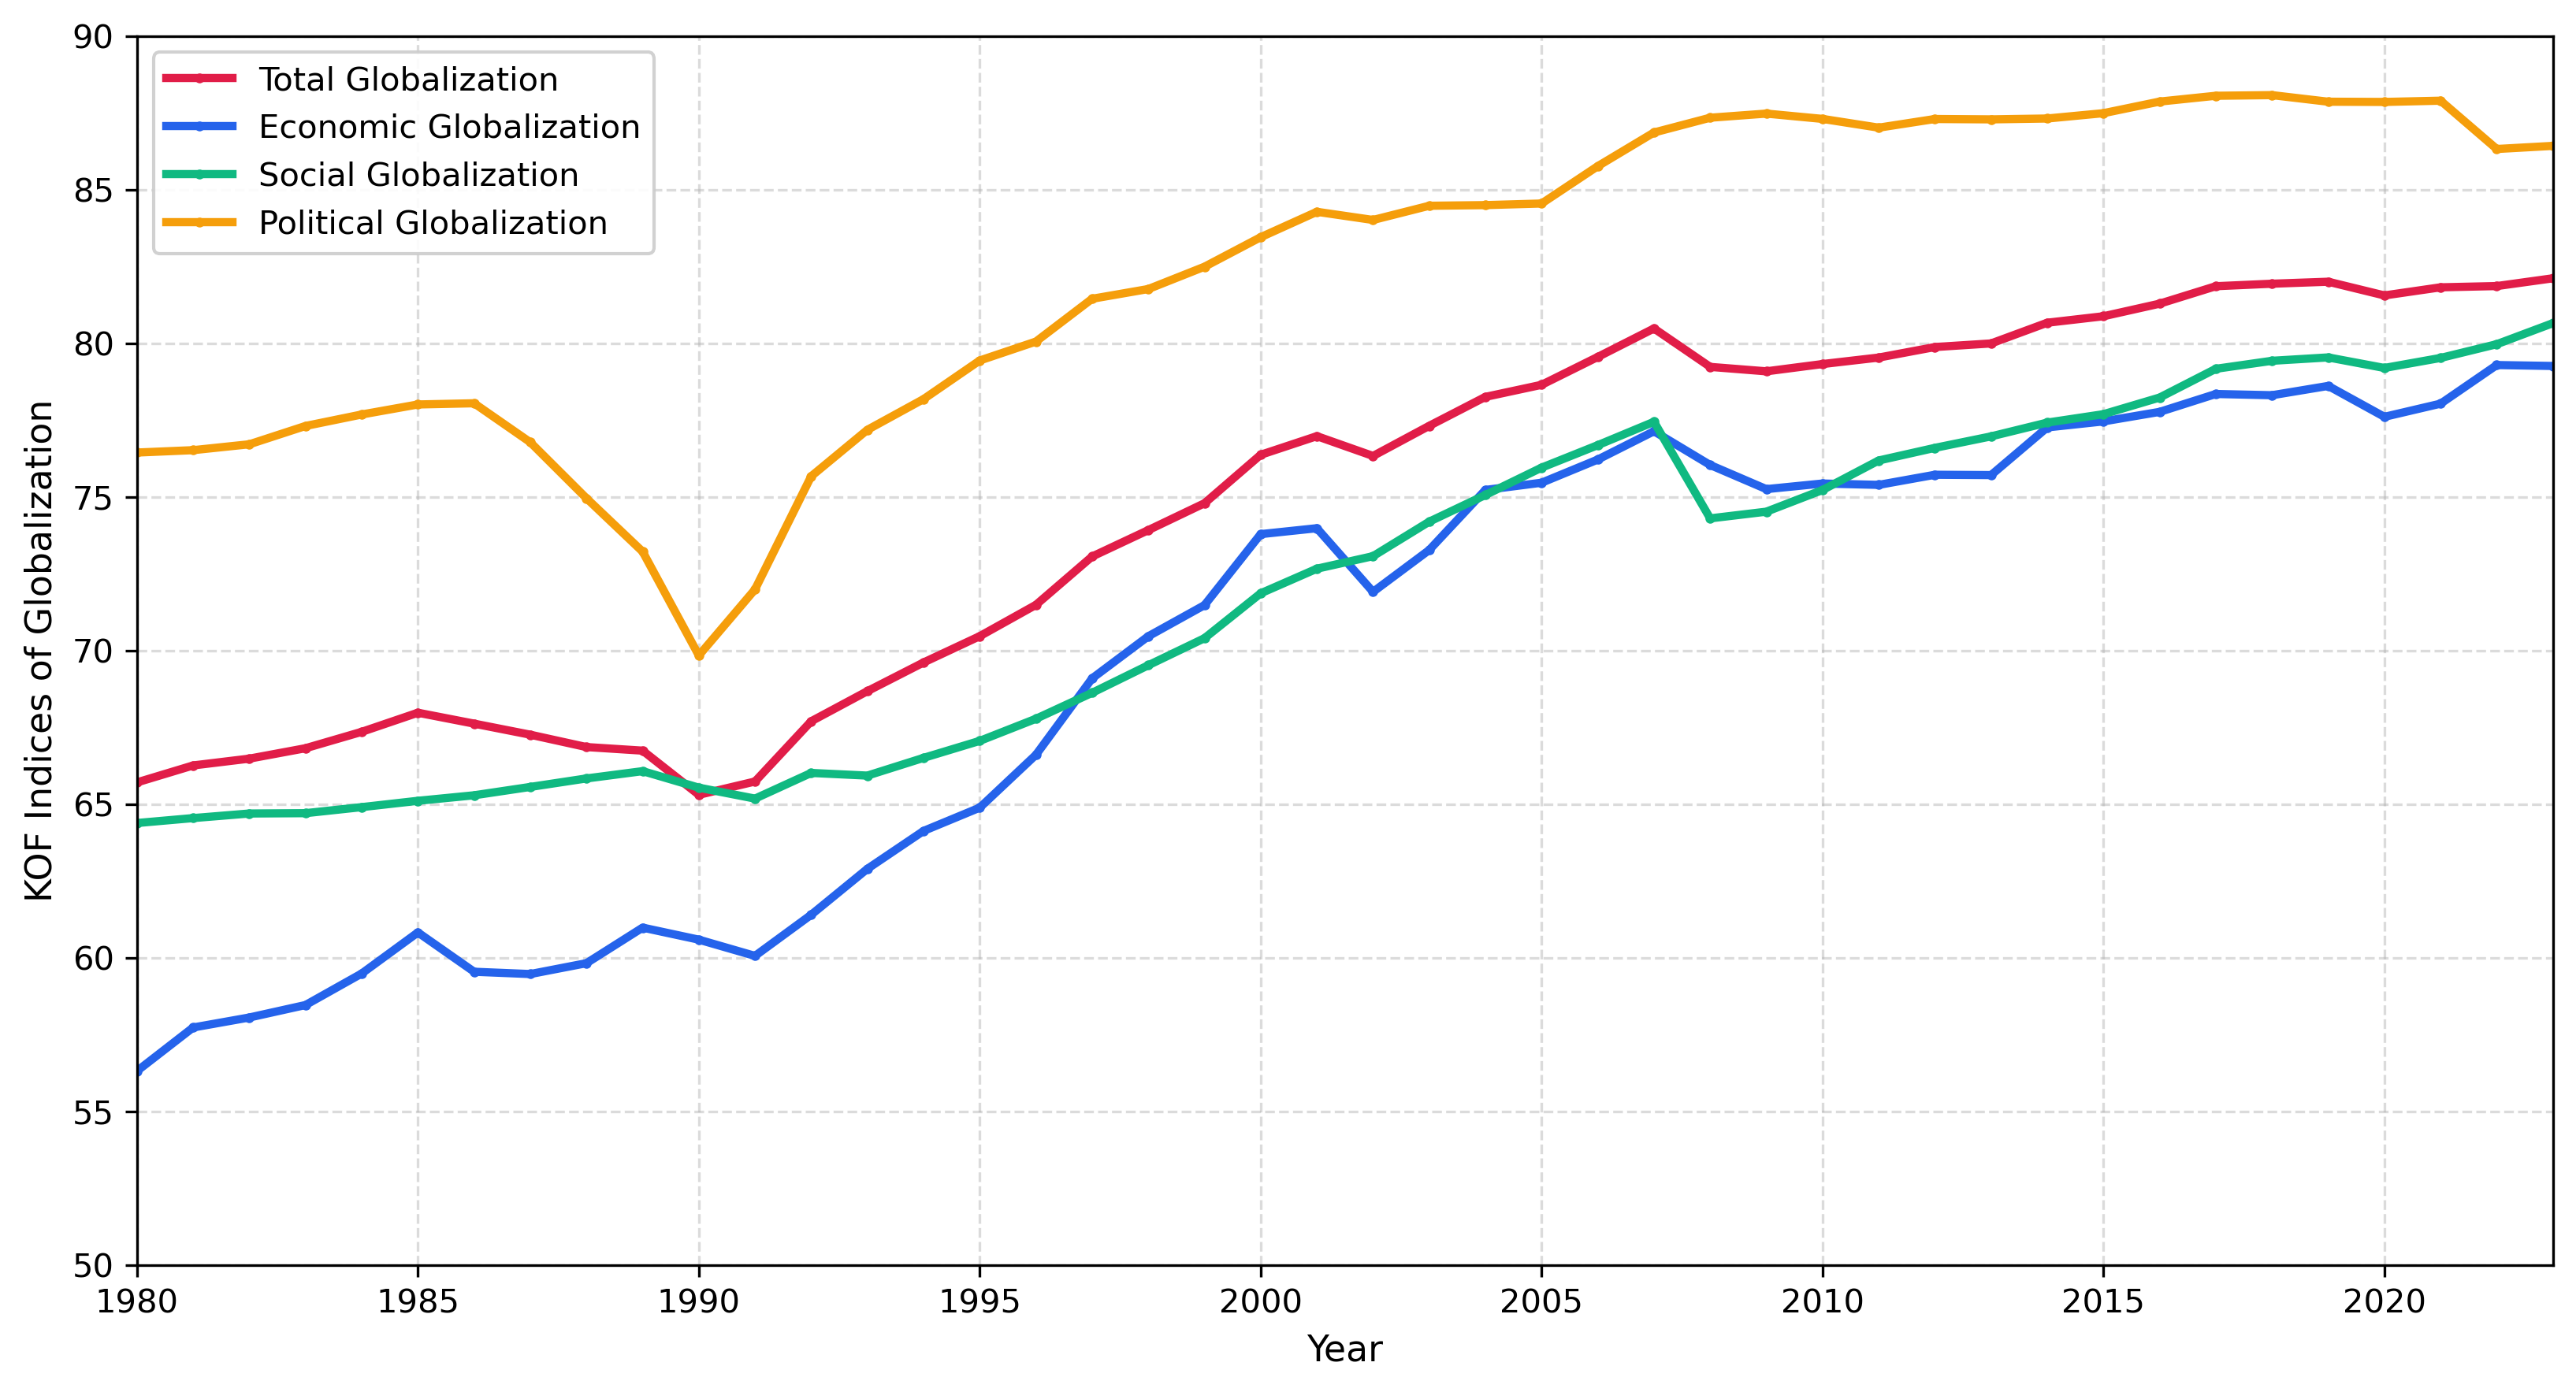
Figure 3.2 — The KOF globalization indices, 1980–2023. All four rise over the period. The dip in political globalization in the late 1980s likely reflects the closing years of the Cold War.
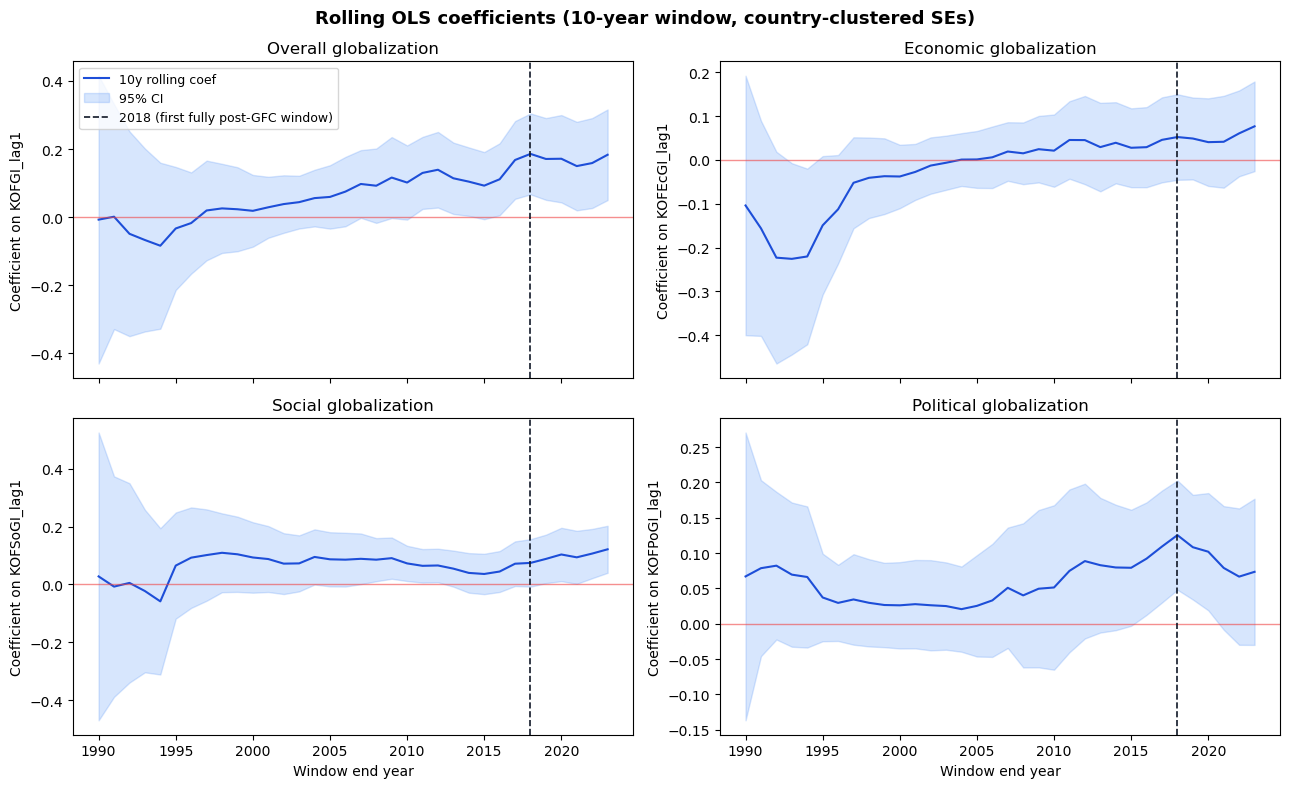
Figure 5.1 — Rolling OLS coefficients over 10-year windows with 95% confidence bands. The dashed line marks 2018, the first window built entirely on post-crisis observations.
Parameter Stability
Rolling regressions: the relationship changes sign around the financial crisis
The coefficient on each KOF index, estimated on 10-year windows. The x-axis gives the window's end year, so the point at 2018 is estimated on 2009–2018 — the first window containing only post-crisis observations. Figures from Table 5.5 of the paper.
Tools
Data & Tools
Comparative Political Data Set 1960–2023 (Armingeon et al., 2025), KOF Globalisation Index (Gygli et al., 2025), OECD Data Explorer, World Bank.
Python (pandas, linearmodels, statsmodels) for estimation and diagnostics; matplotlib for figures; LaTeX for the paper.
Download
Nielsen, J. S., Chen, S. Y. M., & Jørgensen, A. M. E. (2026). Globalization and the Welfare State: A Panel Data Analysis of 32 OECD Countries (1980–2023). Seminar Paper, Department of Economics, University of Copenhagen. JEL: F62, H53, I38, P16, P51. Policy Relevance
The negative coefficients on political globalization in social democratic and Southern European welfare states after 2008 likely reflect the EU's response to the sovereign debt crisis — the European Semester, the Fiscal Compact and a strengthened Stability and Growth Pact — rather than a general globalization effect. Greece and Portugal had conditional lending programmes, Italy and Spain were subject to surveillance, and the result was welfare retrenchment across the region.
The compensation-versus-efficiency debate is normally settled with a single long-run estimate. Our results suggest that number says very little: the association is period-dependent, and the answer an analysis reaches depends heavily on where its data happen to stop.
Social security transfers as a share of GDP is the standard measure, and it is a blunt one. It cannot distinguish a change in the size of the welfare state from a change in the composition of its spending — and that distinction is exactly what policy decisions turn on.
Everything below was run after submission on 3 June 2026 and forms no part of the graded paper. The figures come from the replication package.
The break: 1995 or 2008?
The paper imposes 2008 and tests it with a Chow test, which rejects. That answers the question “is there a break right here?”. A different question is “where is the break strongest?” — and answering it requires tests that search across every candidate date. Two of them point to 1995.
QLR (sup-Wald)
Unknown break date, 15% trimming. Critical values: 8.68 (5%) and 12.16 (1%).
- Overall12.895 → 1995
- Economic16.080 → 1995
- Social10.855 → 1995
- Political11.552 → 1995
Bai-Perron (sequential)
Number of breaks chosen by BIC. Andrews 5% value: 8.68. N = 1,026.
- Trade13.21 → 1995
- Economic12.69 → 1995
- Overall10.40 → 1995
- Cultural, politicalno break
Bai-Perron selects 1995 for seven of nine indices, each with a single break. The two tests do not agree completely: QLR finds a break for political globalization (11.552 > 8.68) where Bai-Perron's sequential procedure does not.
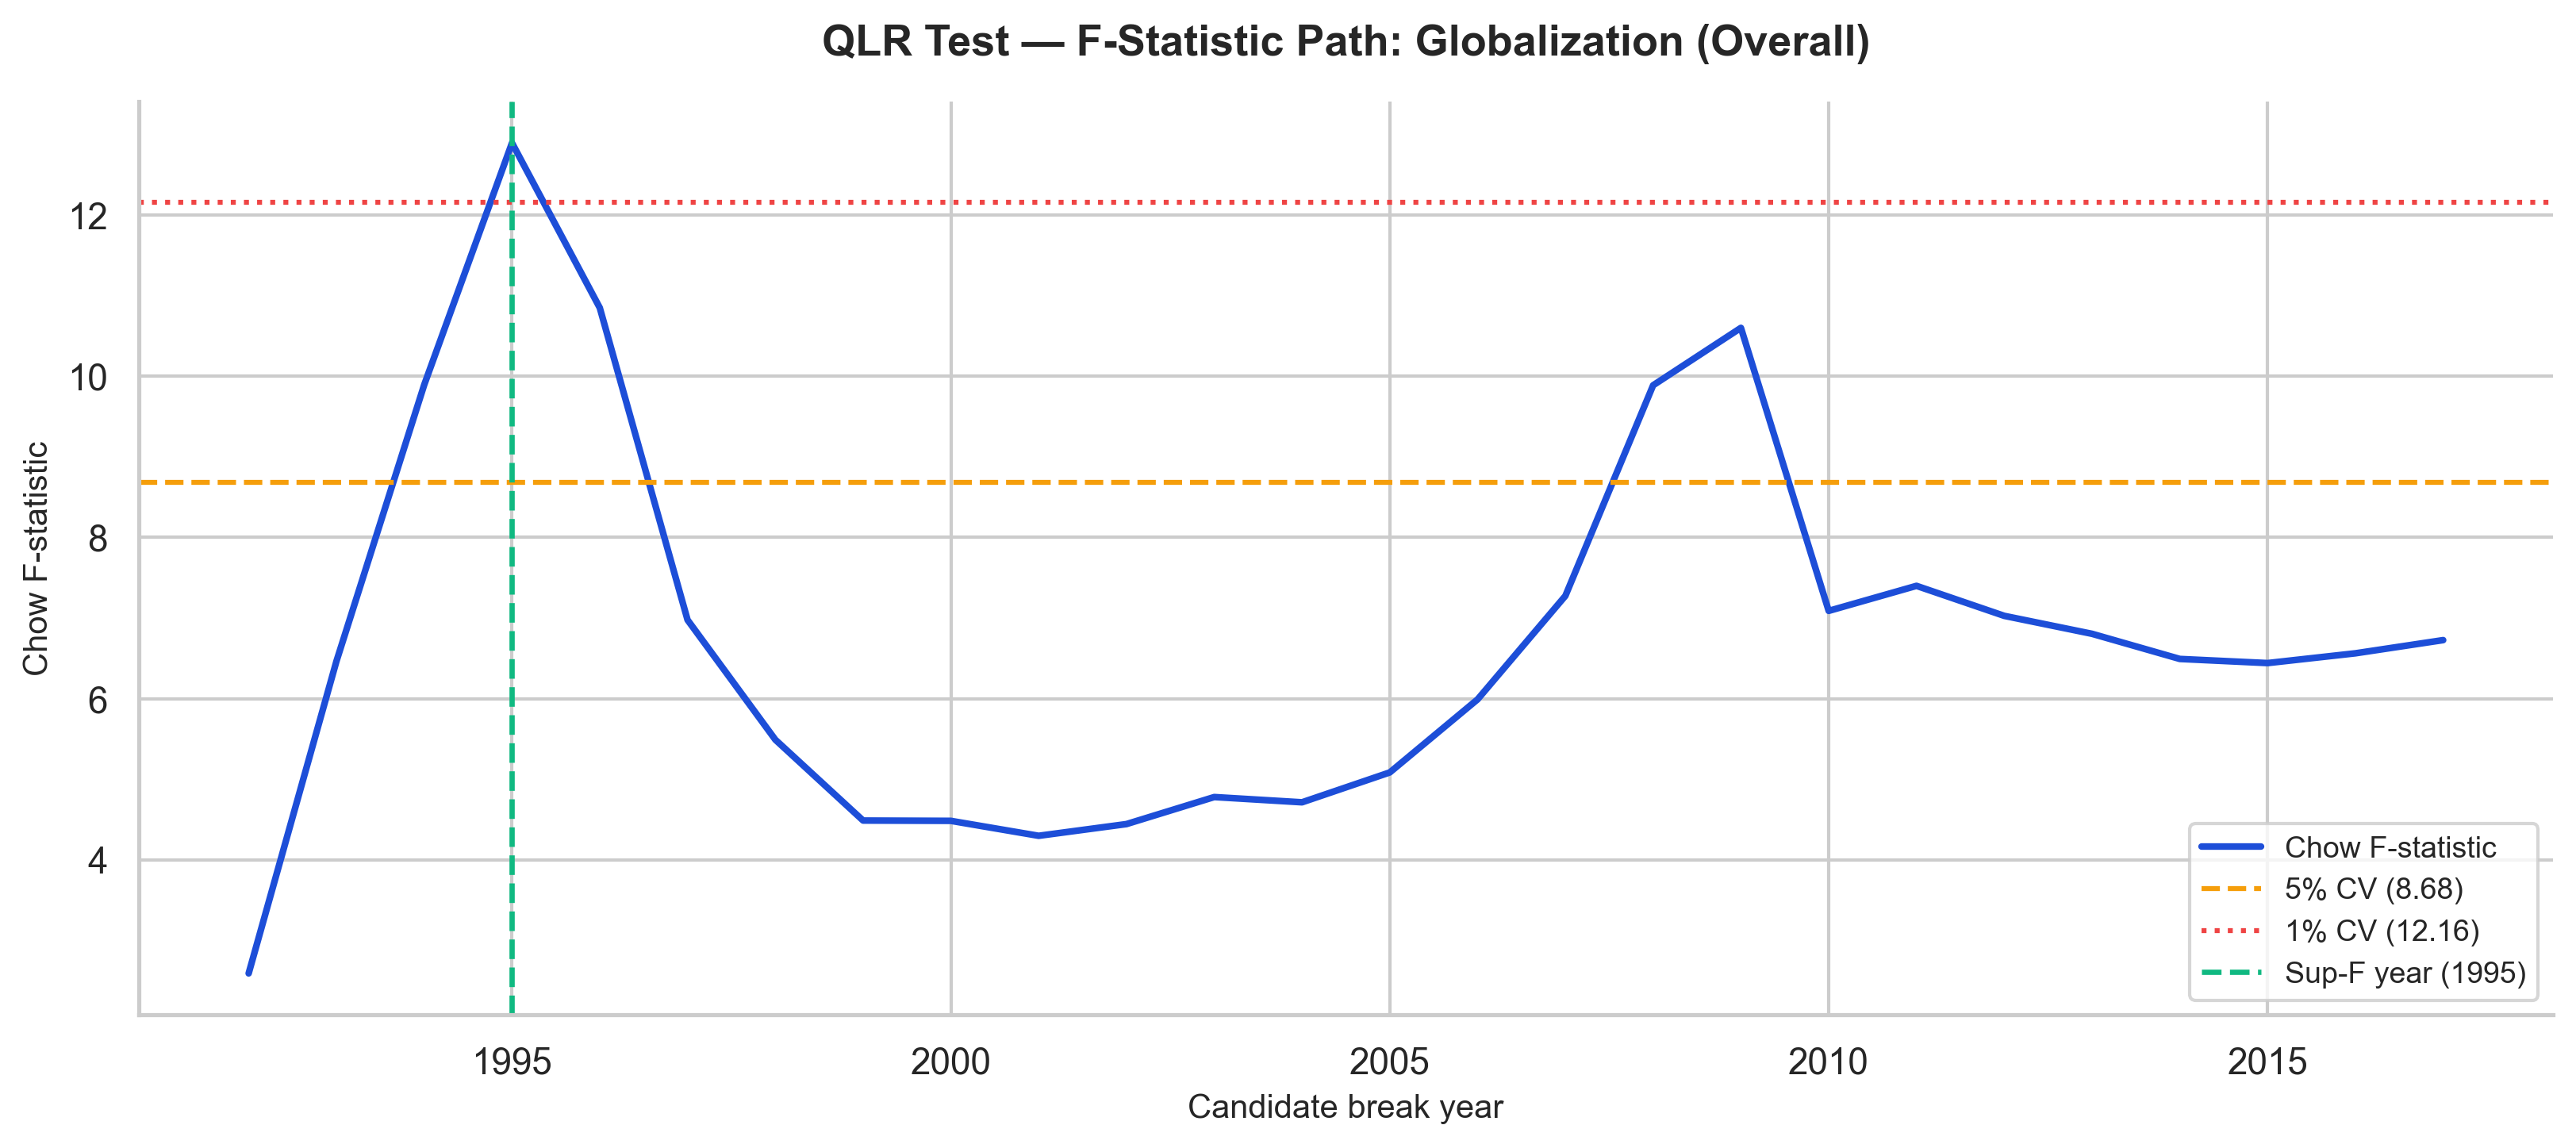
The F-statistic at each candidate break year. The global maximum sits in 1995 and clears the 1% value. But note the second peak around 2008–09, also above the 5% value: 2008 is a genuine break year — just not the strongest one.
What it means
The two results do not contradict each other. The paper's Chow test is right: there is a break at 2008, and the figure shows it plainly as the second peak. But the parameter instability starts earlier — around the close of the Uruguay Round and the founding of the WTO in 1995. The financial crisis amplified a shift already underway rather than starting one. That pulls in the same direction as the rolling regressions: the relationship is historically contingent throughout.
Specification curve
A single estimate can always be a lucky choice of controls. Here are all 64 combinations of the six controls — the complete power set — each estimated separately, so you can see how far the coefficient actually moves.
Nine indices, not four
The paper's main text uses four KOF indices. The analysis behind it covers nine: economic globalization splits into trade and financial, and social globalization into interpersonal, informational and cultural. Two results from that never made it into the paper:
-
Trade globalization has the strongest break of all nine indices (sup-F 13.21 at 1995) — notable because the economic index that contains it is precisely the one that never reaches significance in the main analysis.
-
Cultural globalization is the only index to change sign across the financial crisis — from +0.0482 before to −0.0238 after. With the caveat that settles it: the stars hold only under Driscoll-Kraay standard errors. Under the country-clustered errors the paper prefers, both are insignificant (p = 0.374 and p = 0.394). This is a hint under one error structure, not a finding.
The 32 countries by welfare regime
The classification follows Table A.4 of the paper (Esping-Andersen 1990; Ferrera 1996). The social democratic regime is the reference category in the interaction regressions.